
Analytics
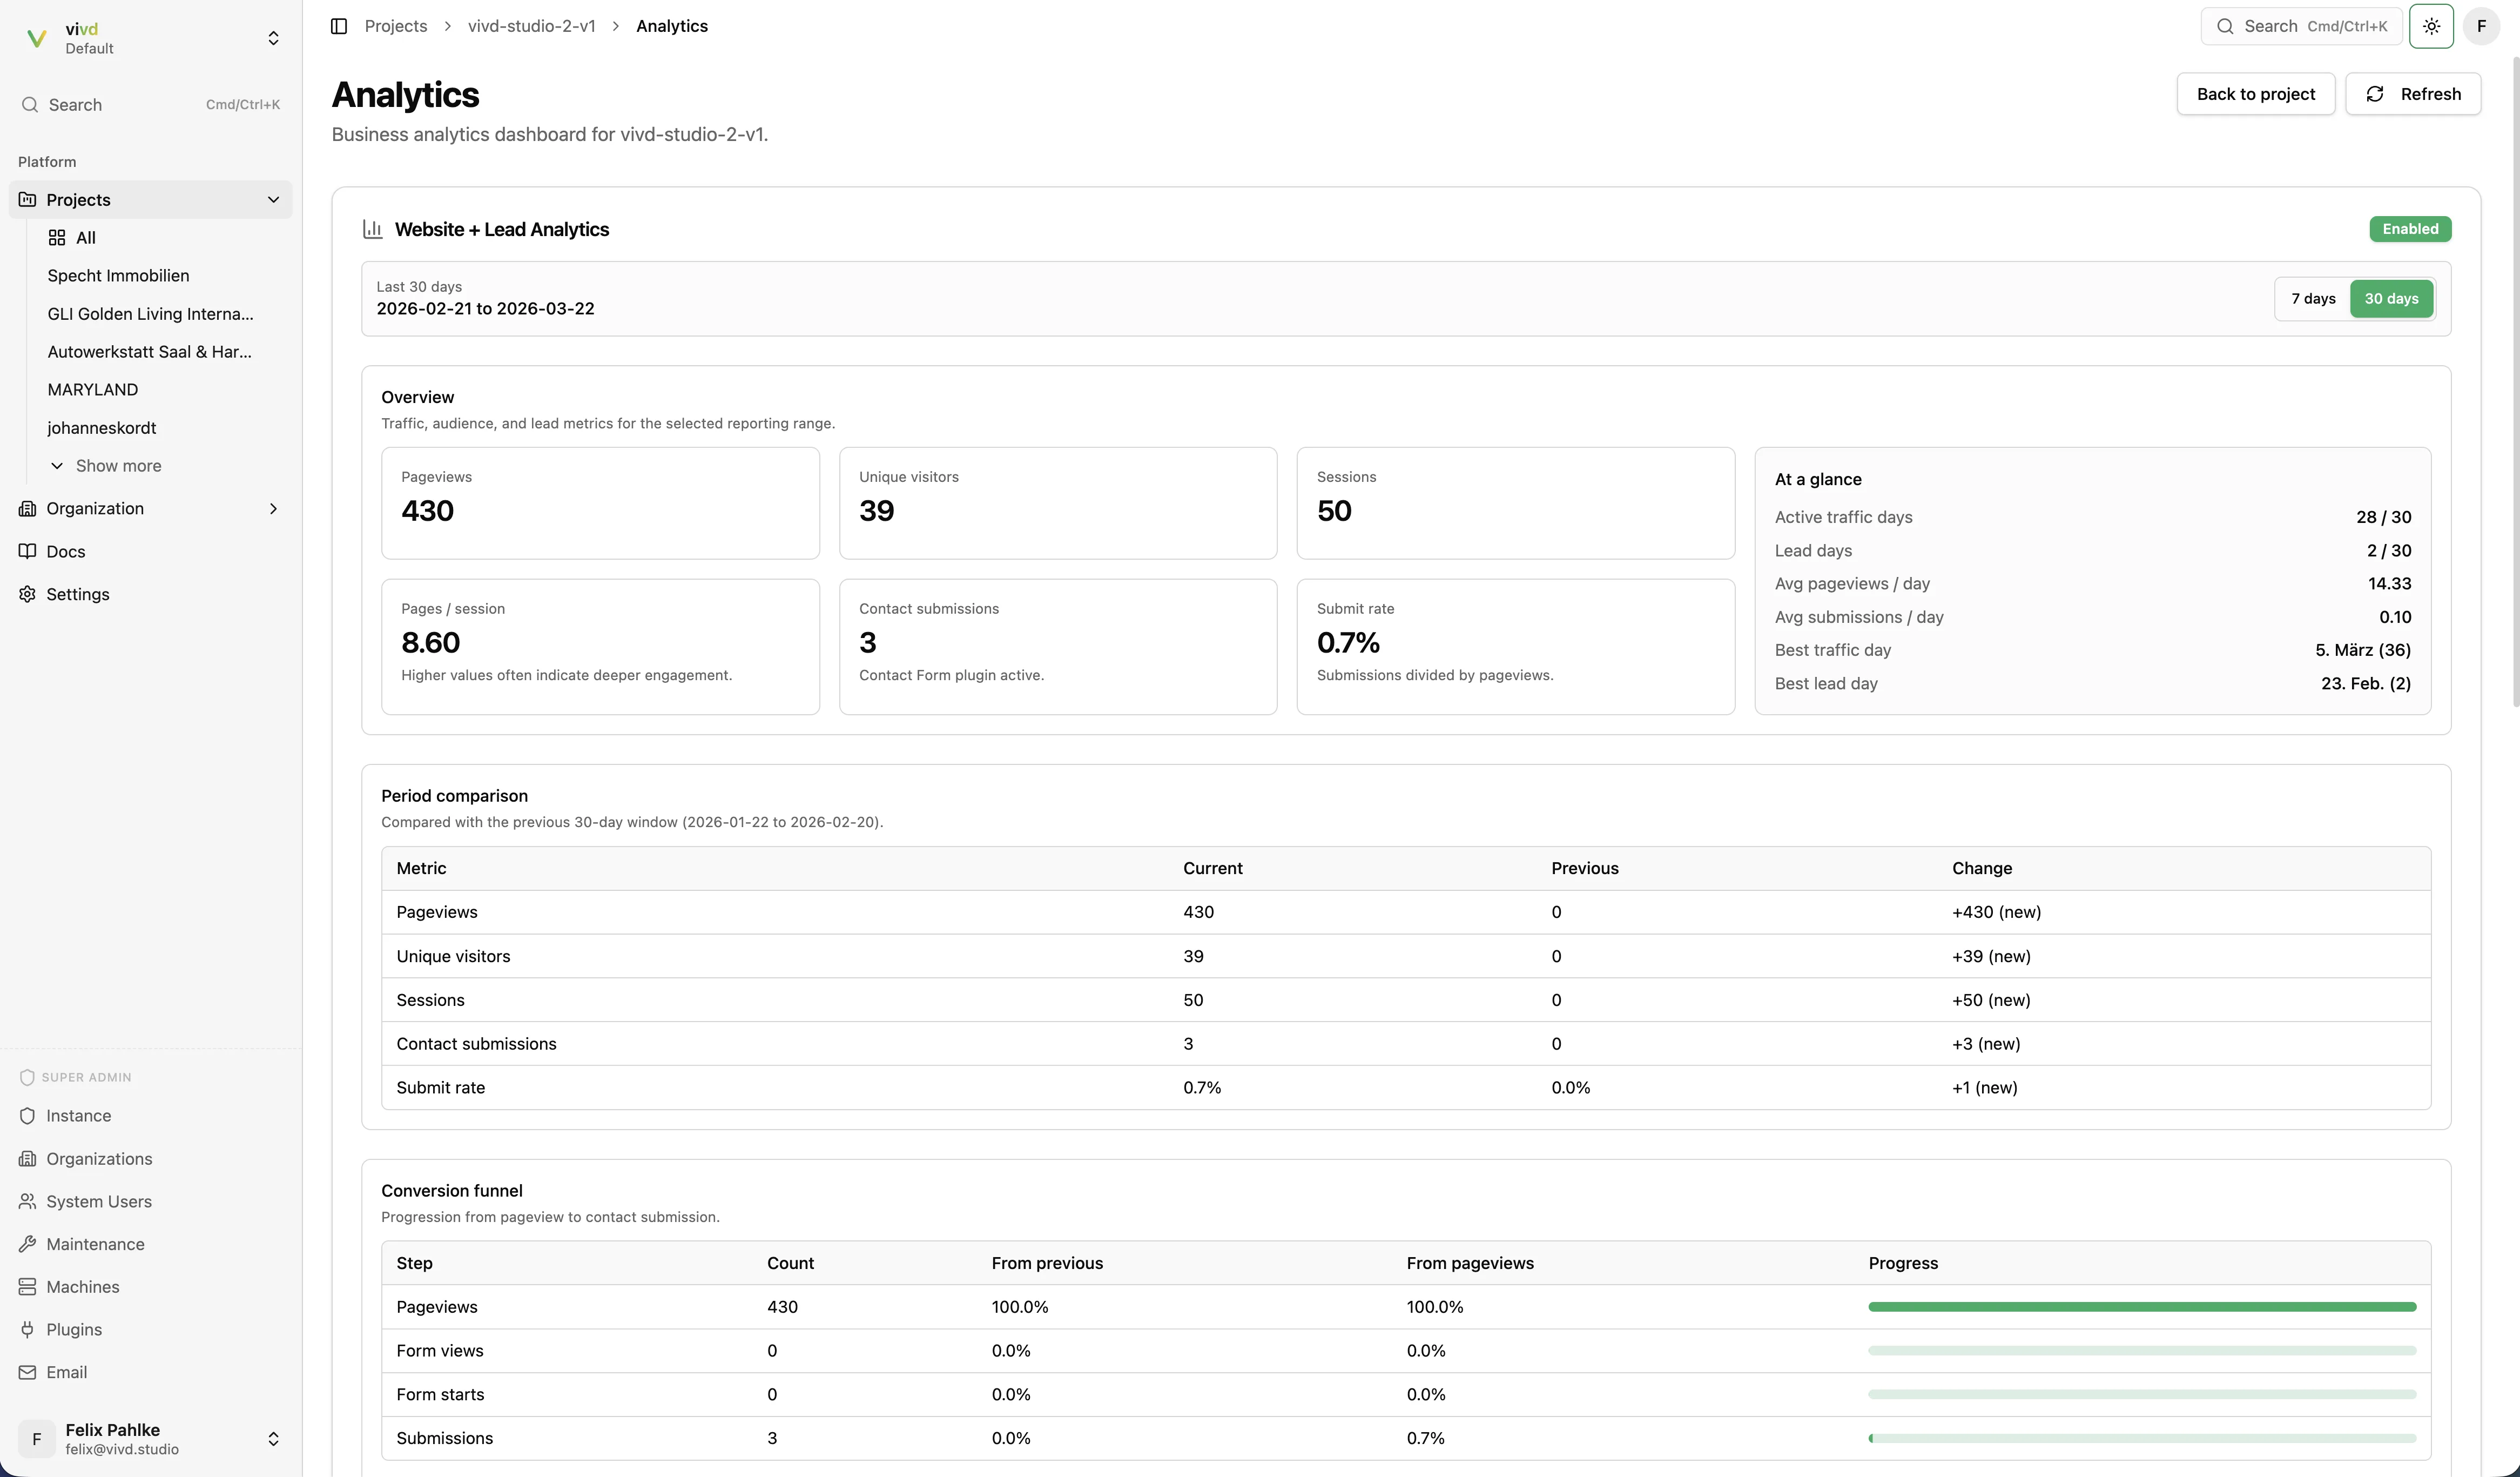
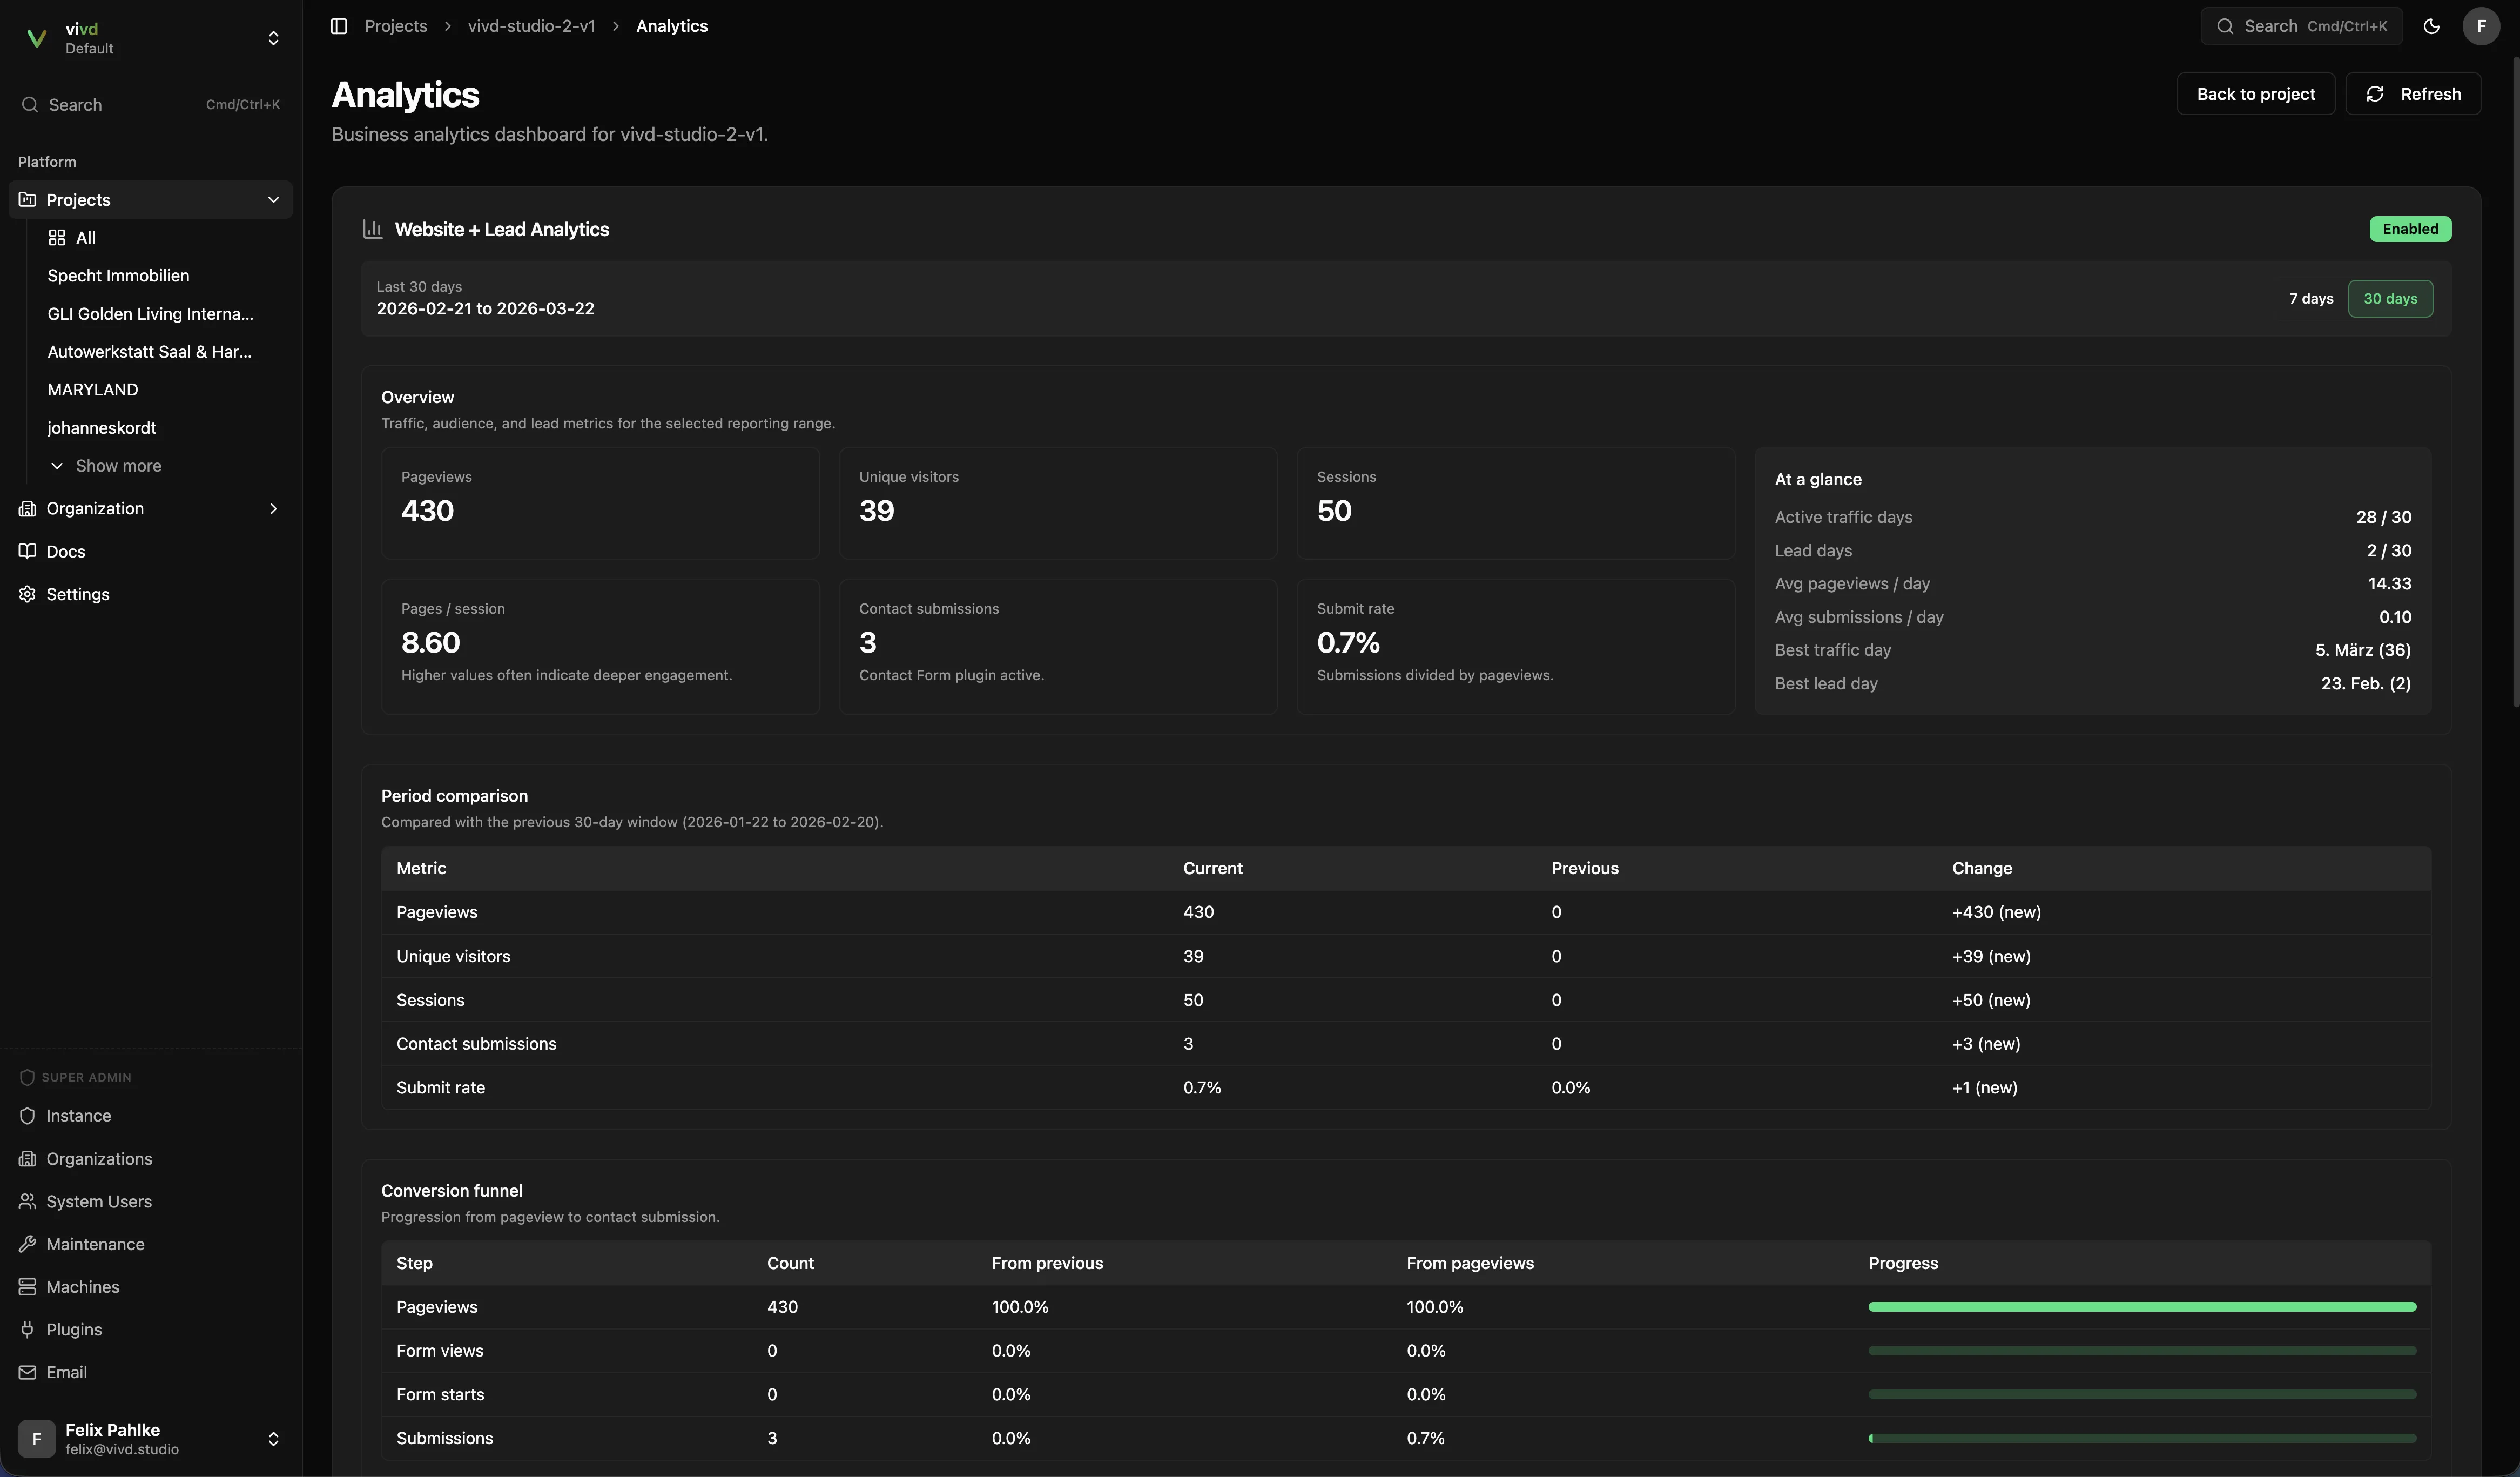
The Analytics plugin adds project-level visibility into traffic and lead activity after a site is live.
What the dashboard is useful for
Section titled “What the dashboard is useful for”- Pageviews, sessions, and visitors.
- Trend comparisons over recent periods.
- Contact-form submissions as a business outcome, not just raw traffic.
Recommended workflow
Section titled “Recommended workflow”- Enable Analytics before launch.
- Publish the site.
- Check the dashboard after traffic starts arriving.
- Compare engagement and submission patterns over time.
What to expect
Section titled “What to expect”Analytics is strongest after launch. A draft project with little or no traffic will naturally show limited data.
Read the numbers in context
Section titled “Read the numbers in context”- Use traffic data to understand whether people arrive.
- Use submission data to understand whether the site converts.
- Look at both together instead of treating pageviews alone as success.